
Frequently Asked Question:
“Molly, how do I know if my social media is working or not?”
The first step to assessing the effectiveness of your online marketing efforts is making sure you are taking time once a month (at least) to dig into your INSIGHTS.
INSIGHTS are the data you get from your online marketing efforts, like your reach on Facebook and Instagram posts, click rates in emails or downloads in your podcasts.

Why do I need to track my Insights anyway?
Measuring your Insights on a regular basis helps you monitor growth (or lack thereof) on your social media channels so you can establish trends and themes.
Think about it like a new fitness routine.
On the day-to-day, it’s hard to notice the fluctuations in our weight or the change in our muscle tone, but over time those daily decisions we make in our movement and nutrition add up. That’s why it’s important in new weight loss regimens to take before and after photos week-to-week or month-to-month, and measure things like our waist circumference or pant size to track changes.
Just like a fitness routine, your online marketing efforts can seem like they don’t move much in the day-to-day, but when we track monthly or quarterly we can see page follower growth, compounding reach, and associate that with business leads or customers retained.
When we have this data at our fingertips, we can use it to answer questions like “What does our audience like to see/hear from us most?” “What platform is most impactful to our online marketing?” “Where are our sales coming from?” or “Is it time to invest in a marketing professional?”
Ok, so where do I find these Insights anyway?
A simple Google search of “Where do I find Facebook Insights?” will lead you to numerous YouTube tutorials and expert articles.
But if you prefer to learn from yours truly, click here for a Facebook Insights Tutorial and here for an Instagram Insights Tutorial.
Wow. That’s a lot of numbers. Which Insights are most important, and what do these different Insights mean?
Note: there is more data in your social platforms than you really need. So let’s keep it simple.
Here are the Insights I measure and track monthly for my clients:
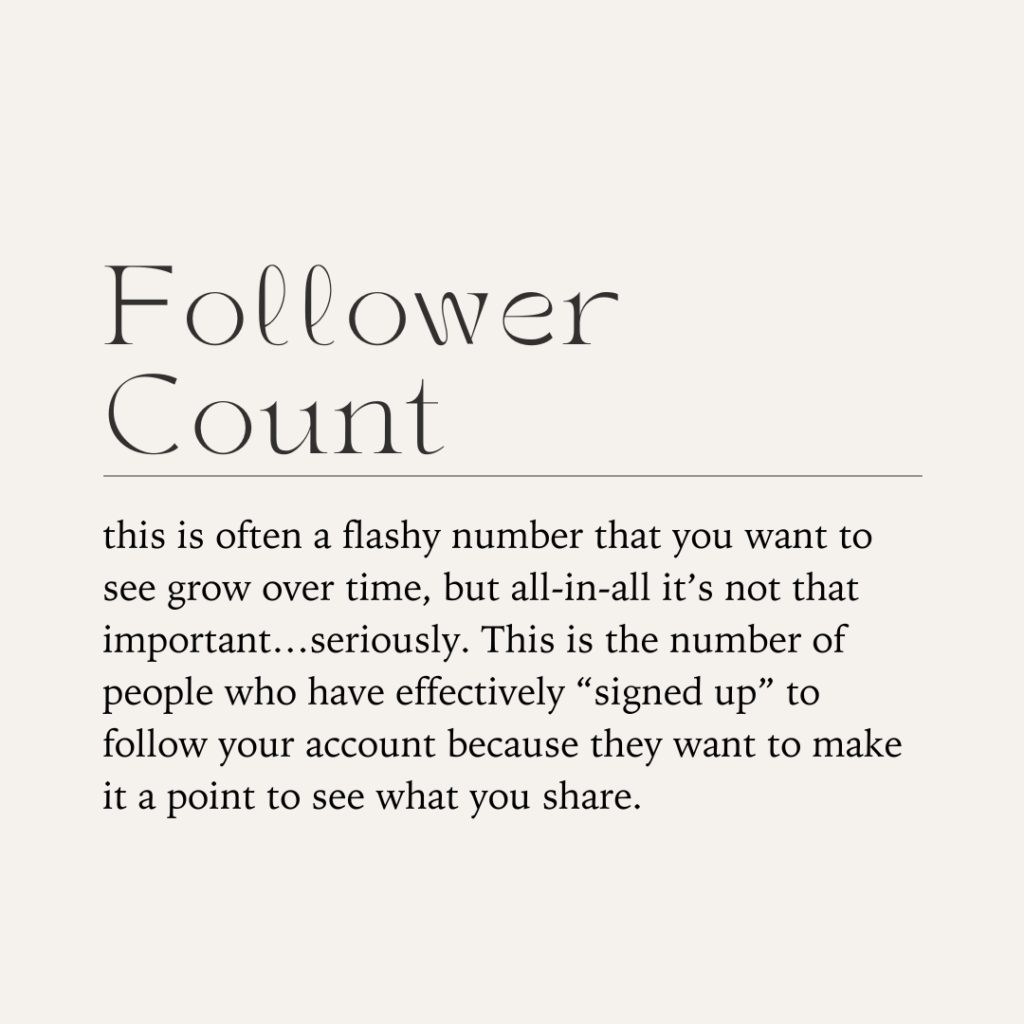
- Follower Count: this is often a flashy number that you want to see grow over time, but all-in-all it’s not that important…seriously. This is the number of people who have effectively “signed up” to follow your account because they want to make it a point to see what you share.
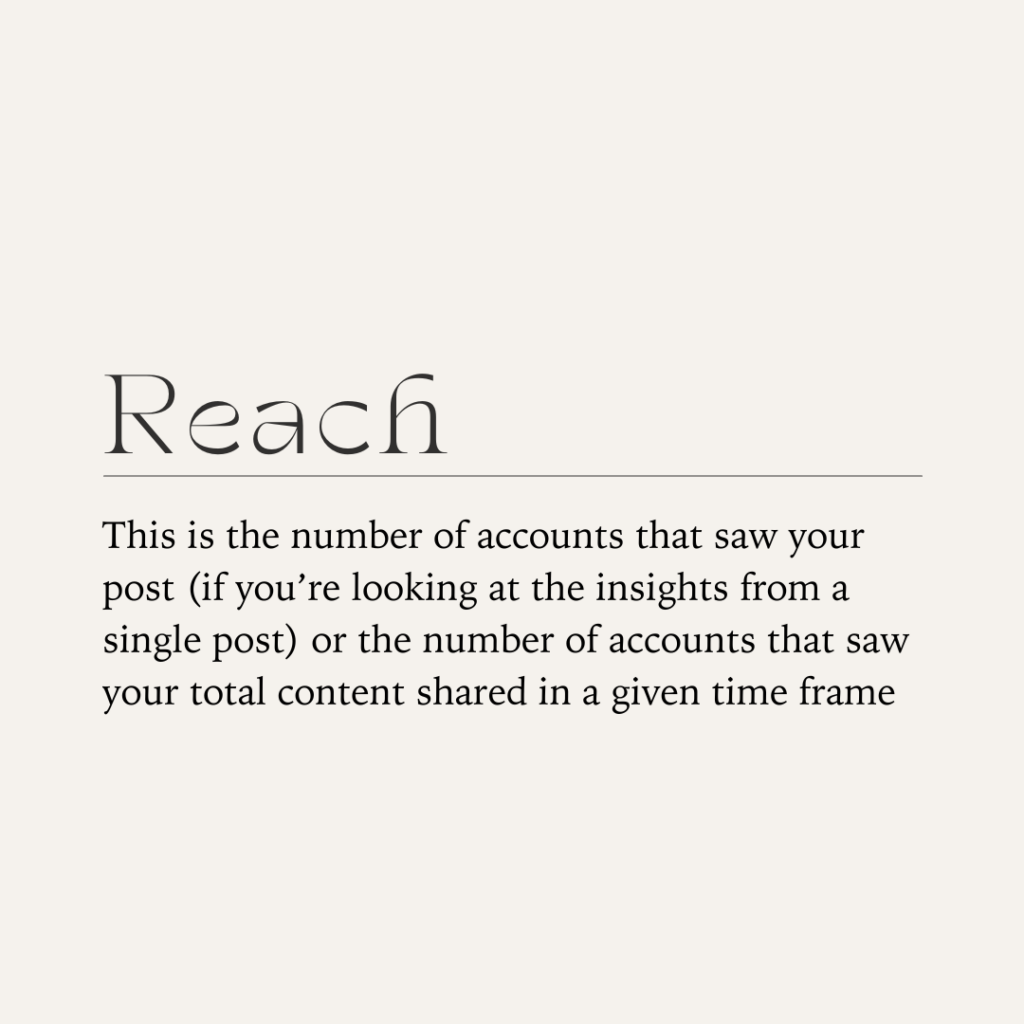
- Reach: This is the number of accounts that saw your post (if you’re looking at the insights from a single post) or the number of accounts that saw your total content shared in a given time frame
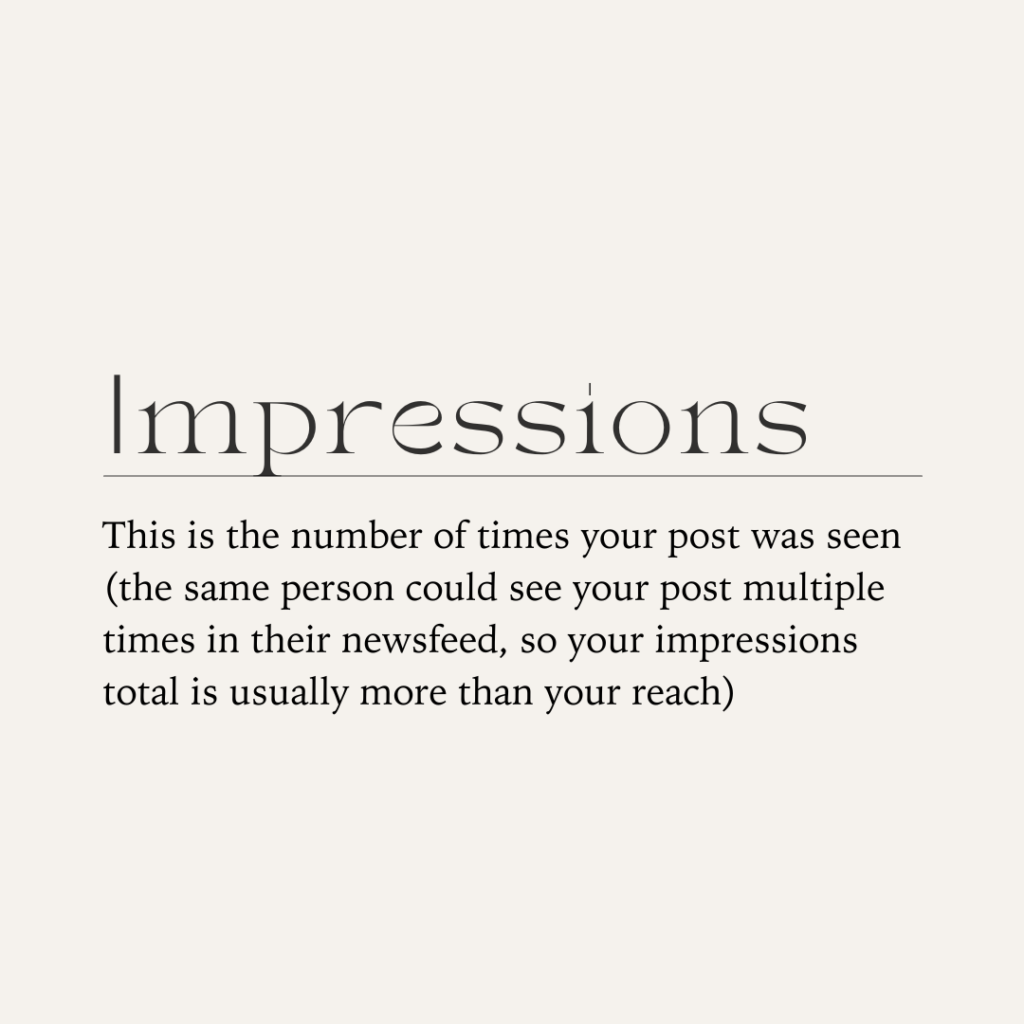
- Impressions: This is the number of times your post was seen (the same person could see your post multiple times in their newsfeed, so your impressions total is usually more than your reach)
- Engagement: The number of times people took action on your post or posts. This is a cumulative number of actions: likes, comments, saves, shares, photo clicks, link clicks, video views, etc. This is a very important number to keep tabs on because the number of engagements impacts how many accounts the platforms will show your content to.
- Link clicks: The number of times accounts clicked into your profile OR links you shared. This is an important number to track because it indicates that your audience is invested in what your content talked about. People went from passive content consumers to actively engaged and wanting to see more from you.
- Profile views: The number of times accounts clicked from your content into your profile page. This indicates that people liked your content and wanted to learn more about who you are and what your business offers.
- Open rate: (email-only metric) The percentage of your emails that were opened by subscribers on your email list. Different industries have different averages, but as a rule of thumb, anything above 20% is very good.
- Click rate: (email-only metric) The percentage of links within your emails that were clicked by subscribers. Different industries have different averages, but as a rule, anything above 1.5% is good.
- Downloads: (podcast-only metric) The number of times your episode was downloaded to a device in a given period of time.
- Views: (video-only metric) The number of 3-second views your video received.

How do I use these Insights to help me make decisions?
Insights can help you learn about your audience and how to meet their needs. This is especially helpful when you intentionally create content, test new concepts, and measure the results.
For example, you can test which time of day your audience is most likely to open an email.
Maybe one week you send all your emails at 6 AM. The next week, you send all your emails over the lunch hour, and the next week, all emails are sent in the evening.
Then at the end of the month (or whatever time frame you are using) look at the data to determine which week got the best open rates and click rates, and use that to determine your typical email send time.
For social media, this testing can assess what day of the week to post, how often to post, which platforms get you the best results, topics your audience likes to see you share about, content formats they are most likely to consume, etc.
How often do I need to track my Insights?
I recommend doing a deep dive of your Insights on the first of each month and recording the data in a safe place.
Where should I record my Insights?
A simple spreadsheet is a great way to record your Insights data over time. Or if you’re more visual, put it into a pretty Canva document!
Phew.
That’s a LOT of info! But it’s important to start tracking your numbers for a month or two to get baseline data and then begin to make data-driven decisions.

Be the first to comment